> BillsChiefsNFL
> BillsChiefsNFL
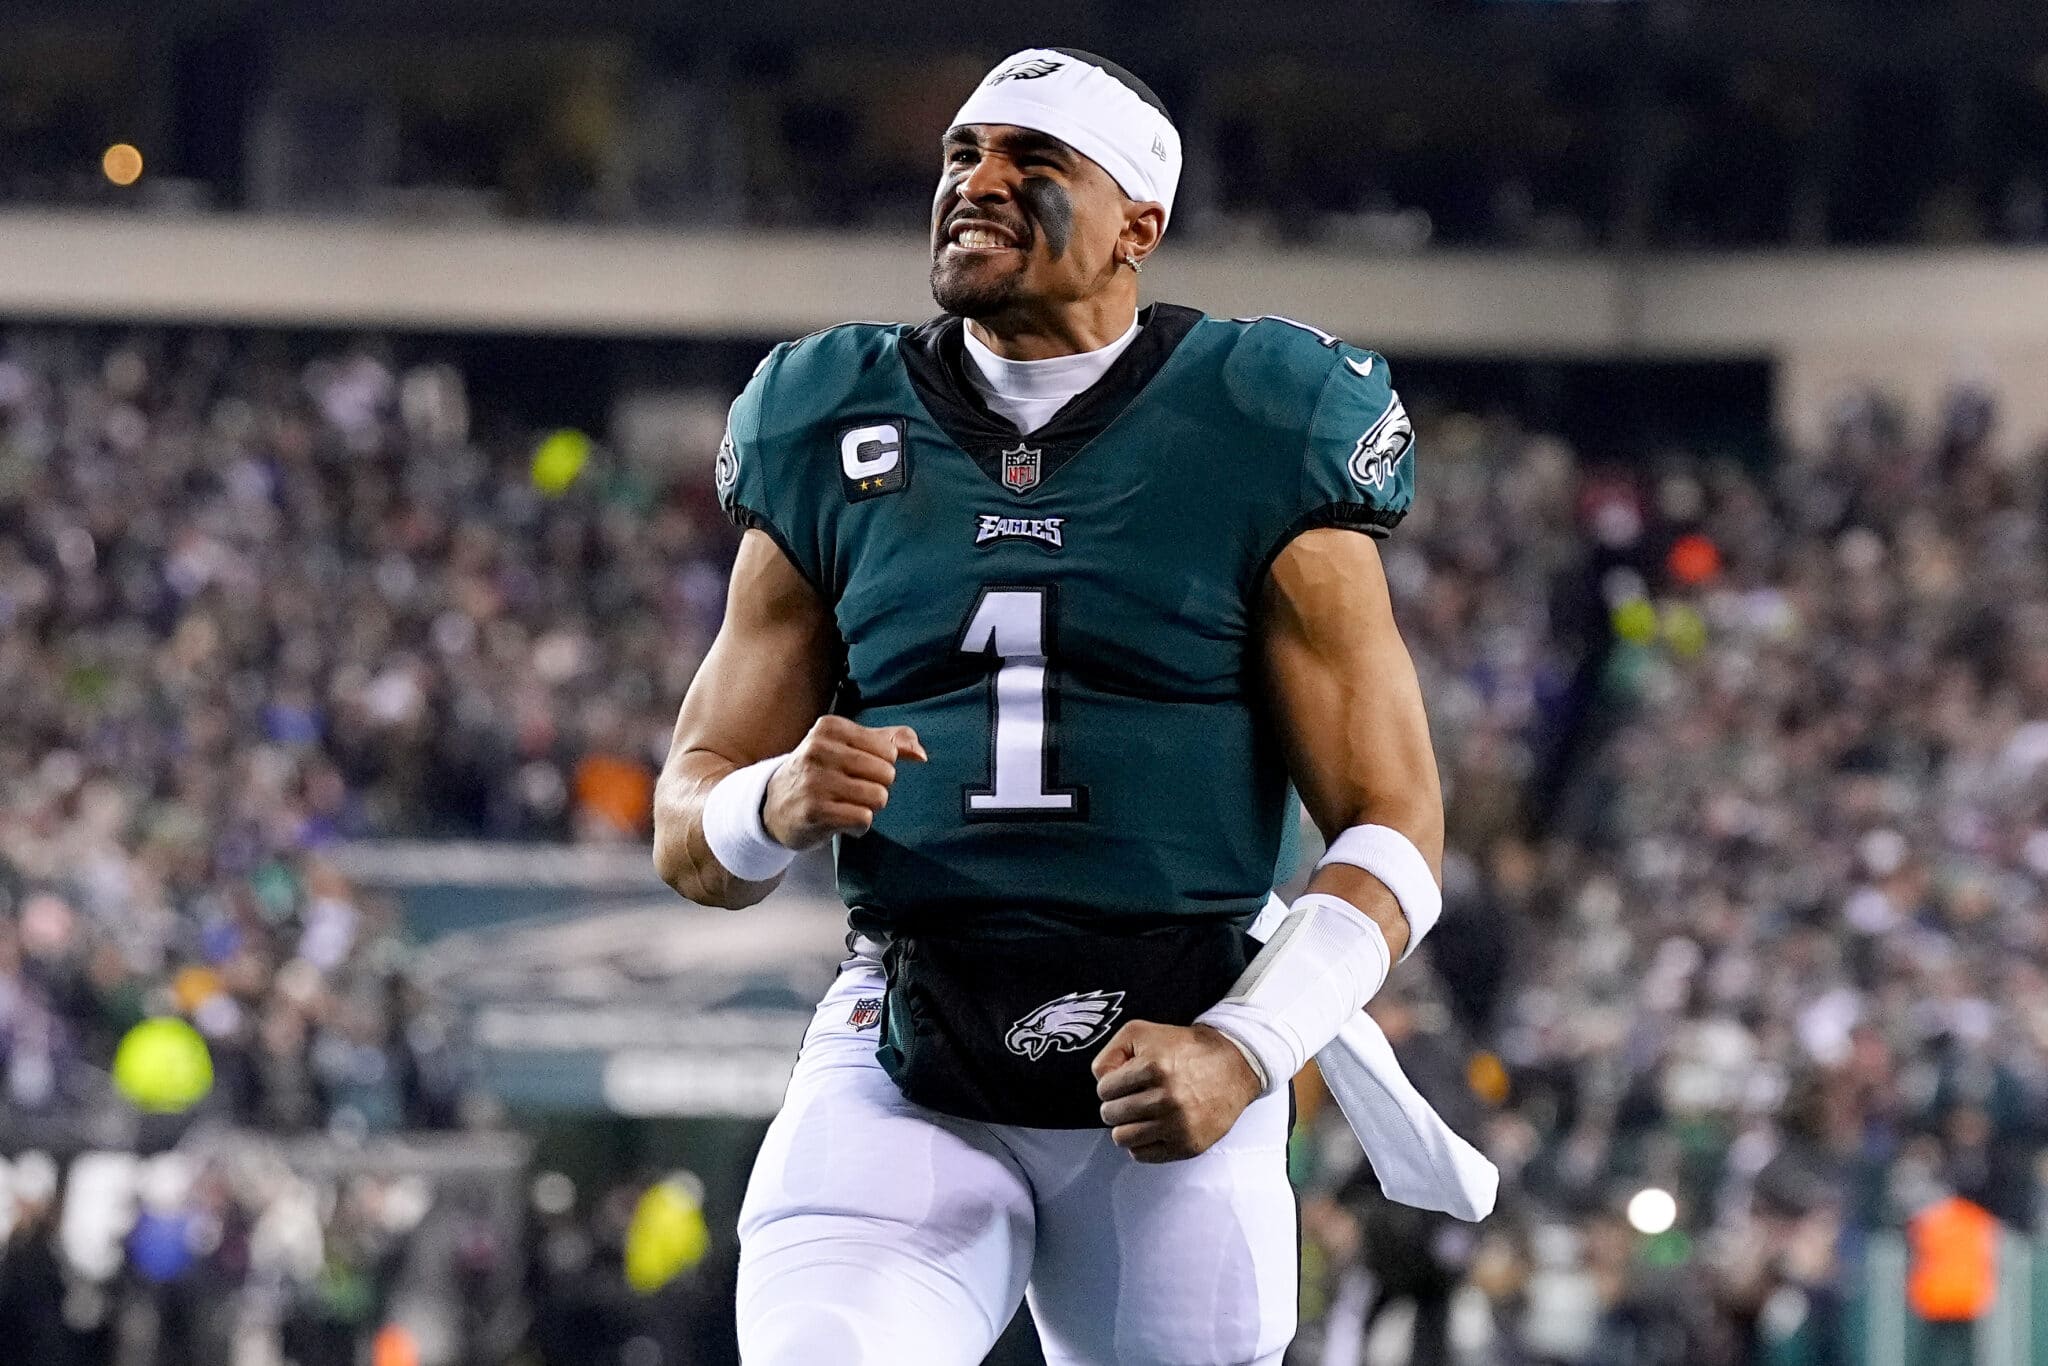
Sunday marks just the 59th Super Bowl in NFL history, and the Kansas City Chiefs and Philadelphia Eagles have managed to meet in two of the last three. No one would dare call these teams fraudulent as we were talking in November 2023 about them meeting in a Super Bowl rematch after both teams led their conferences before their last showdown.
That’s why Super Bowl LIX is probably the best matchup it could be this year between the best teams over the last three seasons. Also, Super Bowl LVII was a great game with an underwhelming finish after the Eagles committed a defensive holding penalty, making Kansas City’s game-winning field goal a formality in the closing seconds of a 38-35 final.
This is Philadelphia’s chance for revenge, and the Chiefs are just a 1.5-point favorite at top-rated sportsbooks. It’s a great matchup with plenty of storylines we’ll explore the rest of this week before a full preview on Thursday and picks on Friday.
But I have come up with a new team metric that suggests the Chiefs are more likely to win this game than the Eagles. If there’s a way to make Eagles fans even more annoyed, I’ve been calling it Fraud Alert Rating, or FAR for short, and I’ve already teased it in the NFC and AFC previews for Championship Sunday.
Now is a great time to explain it in more detail as another data point to consider for predicting playoff games in the NFL.
If we are just being honest, we do not have a ton of data to go on when it comes to figuring out what it takes to win a Super Bowl. After Sunday, only 59 teams since 1966 will have won a Super Bowl. By the time September ends and you have to wake up Green Day, your modern NFL season already has more than 59 games in the books.
However, we also have data on the nearly 1,700 teams who didn’t win a Super Bowl since 1966. The relatively small sample size of winners doesn’t mean we aren’t always trying to figure out what it takes for a team to win a championship.
Each season also provides valuable lessons for the kind of team that doesn’t win a championship, and those lessons are just as important to learn for building a legitimate contender.
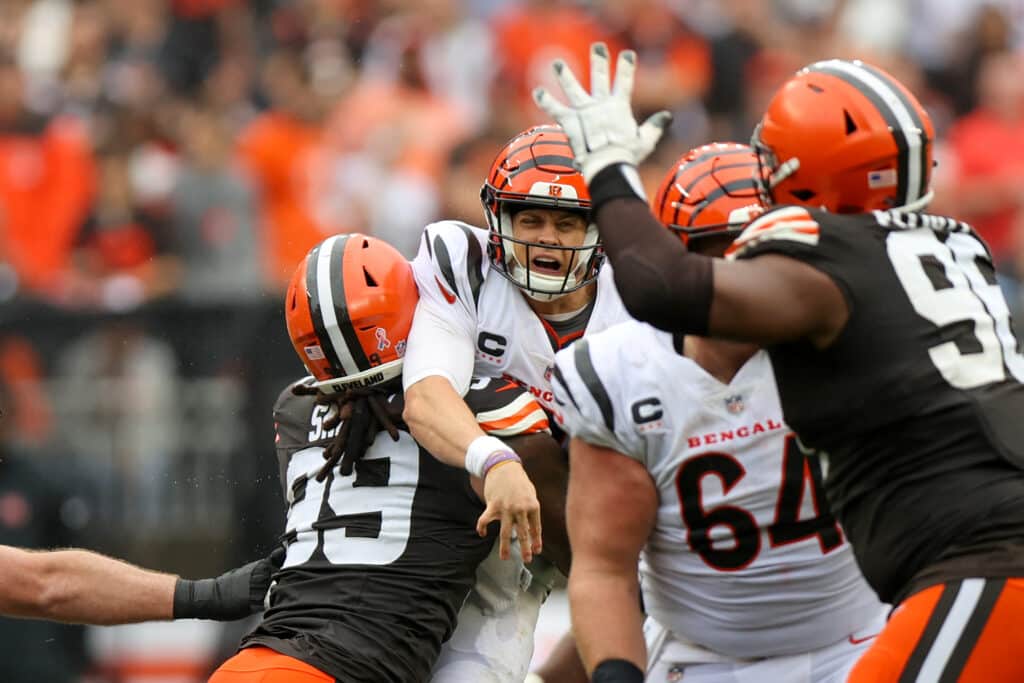
For instance, the 2024 Bengals may have had the league’s leading passer (Joe Burrow), a triple-crown receiver (Ja’Marr Chase), and the individual leader in sacks (Trey Hendrickson), but a team that’s only +38 on the scoreboard with a defense that bad and a strength of victory that low likely isn’t winning enough games to make the playoffs, let alone reach a Super Bowl. The Bengals finished 9-8 and missed the tournament for the second year in a row.
For as great as quarterback Jayden Daniels was for Washington, no rookie quarterback has ever started a Super Bowl. No one even came close to trying to do that with a defense as below average as Daniels had in 2024, and the Eagles made sure that streak continued by fittingly scoring a Conference Championship Game record 55 points.
The Chiefs also made sure the Five-Year Rule keeps proving true as no team has ever won its first Super Bowl by starting the same quarterback for the same coach for more than five seasons. The Bills will try (again) to buck that trend in Year 8 of Josh Allen and Sean McDermott in 2025, and the Ravens are in the same exact boat with Lamar Jackson and John Harbaugh.
But if we are fortunate enough to be around for a few dozen more Super Bowls, chances are we’ll see some of these streaks end and unlikely winners emerge.
It took 16 seasons after they expanded the wild card in 1990 for a No. 6 seed (2005 Steelers) to win the Super Bowl, and it took 56 seasons for a Super Bowl to not have any top three seeds when the Bengals and Rams met in the 2021 season. We’ll see how long it takes for the first No. 7 seed to break through as none have come close since 2020.
For that matter, the Chiefs are one win away from a three-peat of Super Bowl wins, another feat that’s never been done. The last time there was a Super Bowl with this much history on the line, the 2007 Patriots were 18-0, one win away from the first undefeated season since the 1972 Dolphins a cool 35 years before them. The Giants pulled off the epic upset, and no one has been that close to the perfect season since.
This is all to say that the NFL playoffs are an inexact science thanks to the one-and-done format where anything can happen in a single game, and we only have 59 seasons of data to go by to predict what is likely to happen.
When I said the Commanders probably don’t have the defense to win a Super Bowl with a rookie quarterback this year, that was a very informal way of saying the probability is practically zero. There’s certainly no precedent for a team like that winning it all.
We go by what data we have, and in watching the 2024 season unfold, there was a statistical profile around the Buffalo Bills that stood out to me as the kind of team that would get exposed in the playoffs rather than win a Super Bowl, and that led to the creation of Fraud Alert Rating.
This is where Chino Moreno would come in with “I don’t care where just FAR” as a nod to “Be Quiet and Drive (Far Away).”
Fraud Alert Rating (FAR) is a composite score I’ve calculated for each NFL team since 2002 (the 32-team era) based on only their full regular-season data in these three areas:
I don’t know if it’s the most aptly named metric I have ever created, but it does grab your attention, and it captures what I feel are teams with inflated value. These are teams who win a lot of turnover battles to give their offense short fields to boost their scoring when they may not have the yardage numbers to back up that level of scoring efficiency, and they’re also doing it against a weaker schedule than most of the NFL.
Each team is only compared to the rest of the NFL for that season in these three metrics using z-scores. With most stats, you want to rank at the top or bottom of the list. But FAR is not like most stats. FAR is similar to air yards (aDOT) in that this is really a style of play stat where we’re looking for outliers. You don’t necessarily want to rank too high or too low in FAR just as you would for air yards.
For example, of the 133 teams who had a FAR of -2.0 or lower, only 8 of them made the playoffs (6.0%). None of the bottom 111 teams won the Super Bowl, so you’d still rather be near the top of the list than the bottom, but that leaves a lot of wiggle room in between that we’re going to explore below.
With Buffalo, it was a combination of one of the weakest schedules (bad division and just 2-3 against playoff teams with none left to play in the last three weeks), elite field position, and an absurd turnover margin (+24) that was built on a ridiculous +14 margin in lost fumbles (tied for second best since 2000 Ravens).
In fact, I considered using fumble margin instead of turnover margin and probably will run those numbers in the offseason to see if it’s more predictive. But I just used turnover margin for now, and sure enough, the Bills led all 2024 teams in FAR with a +5.86. That number is so high that it ranks No. 5 out of all 736 teams since 2002.
But as fate would have it, the top three teams in FAR in 2024 all reached the Conference Championship Game as I pointed out already. I’m really counting on the Chiefs, who ranked 17th (-0.67), to bail me out and win this championship to show that a high FAR is bad news for winning the Super Bowl.
But let’s look at those numbers.
The first thing you might be saying is why is it a bad thing to dominate in turnovers? Turnover margin is reflective of your offense and defense, and being strong in that area is going to help your field position numbers. The strength of schedule metric has also shown some shaky results for the playoffs as teams who notoriously played soft schedules like the 1972 Dolphins and 1999 Rams still won the Super Bowl.
A hard schedule with a record number of wins against winning teams and playoff teams hasn’t exactly helped the 2023 and 2024 Ravens get to the Super Bowl.
Here’s the thing. Intuitively, a team excelling against a tougher schedule should make you view that team in higher regard. The stat has its flaws as you could run into a team early before they go on a hot streak, or you might catch them when their star quarterback is out for the week or when they rest their starters like the Chiefs did in Week 18 against Denver. But great results against a tougher schedule sounds like less of a fraud to me even if the one-and-done playoff system may show other results.
But something people need to understand is that turnovers are not a reliable predictor of future success in the NFL. They are fluky (botched snap/handoff or an unlucky bounce/deflection), they can be heavy on situational play (end of half Hail Mary, a team throwing a desperation pick down 21 points), and they love to regress to the mean on both sides of the ball.
Sure, some quarterbacks (Aaron Rodgers) might do a better job than most of not throwing many picks on an annual basis, but interceptions are still one of the most volatile stats on a year-to-year basis.
Fumbles are still the shakier stat, and it’s no surprise that the Bills snuck past Baltimore after finishing that game +3 in turnovers, not to mention a dropped 2-point conversion by Mark Andrews that might as well have been a fourth turnover. Then the Bills managed to recover all five fumbles in the AFC Championship Game in Kansas City to win that turnover battle 1-0, so maybe that team was just the luckiest all time with takeaways.
And yet, it still wasn’t enough to reach the Super Bowl.
With that in mind, let’s look at some year-to-year correlations for these stats for the period of 2002-2024. I looked at the three metrics that make up FAR, FAR itself, and other team metrics like point differential, Simple Rating System (SRS), and Defense-adjusted Value Over Average (DVOA). They are ranked from highest correlation to lowest:
| Metric | Y2Y Corr. |
| DVOA | 0.48 |
| SRS | 0.45 |
| Off. LOS/Dr | 0.44 |
| Point Diff. | 0.41 |
| SOS | 0.14 |
| FAR | 0.10 |
| TO Diff. | 0.10 |
Not surprisingly, the things we can agree on that are good for a team to rank high in like scoring differential, DVOA, and SRS have decent correlation from year to year here. I was a little surprised to see field position right there with them at 0.44, then I remembered some quarterbacks notoriously have had great (Josh Allen) or poor (Peyton Manning) field position in their careers.
But notice that the correlation for the strength of schedule is tiny at 0.14 as teams and schedules change too much from year to year. Then the correlation is at its smallest (0.10) for turnover differential, because again, turnovers are not sustainable. Not surprisingly, it’s just 0.10 for FAR given two of the three metrics have negligible correlation.
A team building its success around the turnover battle and the ensuing benefits of field position doesn’t sound like a team you should trust in the long run. Throw in the weaker schedule aspect to boost that FAR, and you’re identifying teams you shouldn’t trust to win the Super Bowl.
Speaking of Super Bowls, we’ve had 22 winners since 2002, which means 44 teams made it to the big show. The 2024 Eagles and Chiefs will make it 46 teams, so let’s split the difference and look at the top 45 teams for these metrics since 2002:
As it turns out, beating teams like the Jaguars and Titans by a combined 84 points doesn’t have good predictive value for how a team will handle the NFL postseason.
Truth be told, this has been the toughest era for regular-season juggernauts to win Super Bowls. But that’s all the more reason to dig for stats to find which teams might be a paper tiger and who is for real.
If you are still on the fence about believing it’s not a good thing to rank high in FAR and the stats that go into it, then let’s look at the real use of this metric: Predicting NFL playoff games.
We can’t calculate FAR until the regular season is over, and we’ve already demonstrated it has poor correlation to the following year. The time to use it is now during the NFL playoffs.
I looked at all 262 NFL playoff games since the 2002 season and compared the teams based on their metrics in the regular season to see who ranked higher in FAR, DVOA, SRS, point differential, and noted who the moneyline favorite was.
Here are the results with the straight-up (SU) record and against the spread (ATS):
| Metric | SU Rec. | Win% | ATS Rec. | ATS% |
| ML Favorite | 166-95 | 63.6% | 114-145-2 | 44.1% |
| Higher Point Diff. | 156-103 | 60.2% | 124-133-2 | 48.3% |
| Higher DVOA | 156-106 | 59.5% | 126-134-2 | 48.5% |
| Higher SRS | 155-107 | 59.2% | 121-139-2 | 46.6% |
| Higher FAR | 136-126 | 51.9% | 129-131-2 | 49.6% |
It’s no surprise that moneyline favorites at the sportsbooks still win the highest rate of playoff games at 63.2%, but it’s also not a surprise they have the worst spread cover rate (44.1%). Life would be too easy if we could just bet on the favorites to cover all the time.
But notice how the things viewed as universally positive for a team like DVOA, SRS, and point differential all produce a playoff winning rate around 59-60% while the team that’s higher in Fraud Alert Rating only wins 51.9% of the time.
Granted, those teams cover the spread at the highest rate (49.6%), but they sure don’t win like you’d expect if this was a legitimately good thing to rank high in.
Expressed another way, the team with a higher fraud rating is 9 percentage points less likely to win a playoff game than teams that rank higher in proven efficiency metrics. There’s something to this.
Here is more data with these metrics for the last 23 postseasons:
Next, let’s look at these results broken down by round: Wild Card (WC), Divisional Round (DIV), Conference Championship Game (CG), and the Super Bowl (SB). These are just straight up records:
| Metric | WC | Win% | DIV | Win% | CG | Win% | SB | Win% |
| ML Favorite | 63-39 | 61.8% | 61-31 | 66.3% | 32-14 | 69.6% | 10-11 | 47.6% |
| Higher Point Diff. | 62-40 | 60.8% | 58-32 | 64.4% | 26-20 | 56.5% | 10-11 | 47.6% |
| Higher DVOA | 64-38 | 62.7% | 57-35 | 62.0% | 26-20 | 56.5% | 9-13 | 40.9% |
| Higher SRS | 61-41 | 59.8% | 57-35 | 62.0% | 26-20 | 56.5% | 11-11 | 50.0% |
| Higher FAR | 53-49 | 52.0% | 54-38 | 58.7% | 20-26 | 43.5% | 9-13 | 40.9% |
Once again, teams ranked higher in FAR, suggesting they’re the bigger fraud, win fewer playoff games in every round:
It gets more interesting once you start combining these metrics together and sorting the games by the FAR differential.
In relating this back to Super Bowl LIX, we said the 2024 Eagles ranked No. 2 in FAR (+3.86) for the season, which is still a decent ways behind No. 1 Buffalo (+5.86), who the Chiefs just took out.
But with the Chiefs ranked No. 17 at -0.67, that creates a pretty big FAR differential of 4.54 between these teams, the fourth-largest in the last 23 Super Bowls. For what it’s worth, in Super Bowls with a FAR differential of 3.0 or higher, the team with the lower FAR is 6-2, which sounds promising for the Chiefs, who won all three of their Super Bowls with the lower FAR.
As for something optimistic for the Eagles, 19 of the last 22 Super Bowls have been within one score in the fourth quarter, so only three games were blowouts, and they all were three of the biggest wins for a team with a higher FAR:
If someone is getting blown out in this game, a low-probability outcome, it is more likely the Chiefs, because they don’t blow teams out, and the Eagles have the better defense and an explosive offense while the Chiefs play more methodically.
But this is a significant gap in FAR that should have Eagles fans wondering if they have the experience in pulling out close games against good teams to overcome the Chiefs here, who are 13-0 in close games and winners of 17 straight one-score games.
We’ve already seen the Eagles nearly lose at home to the likes of the Browns, Jaguars, and Panthers this year, and how long can you rely on turnovers and 60-yard runs to go your way?
Now, you might be saying it’s not a fluke that the Eagles forced the Commanders to lose three fumbles in the NFC Championship Game after they did the exact same thing to that offense in Week 16. Maybe, but the Eagles having 10 takeaways without a single giveaway in the playoffs, including a stunning +6 in fumble recoveries, sounds pretty ripe for some regression as it’s just not sustainable.
Most takeaways without a giveaway in NFL playoff history
— Scott Kacsmar (@ScottKacsmar) February 3, 2025
1. 2024 Eagles +10 (3 games)
2. 1943 Bears +6 (1 game)
2. 1968 Raiders +6 (2 games)
2. 2013 Chargers +6 (2 games)
The Chiefs also feel due for some takeaways since they haven’t had any in their last three games. They haven’t had a 4-game streak without a turnover in franchise history.
But what else do we know about these teams? The Chiefs were only +59 in scoring differential this year while the Eagles were +160. Since 2002, in Super Bowls where one team had a +100 edge in scoring differential over the other, those teams are just 1-5, another good sign for the Chiefs.
We also know the Chiefs sunk their own stats with that 38-0 loss to the Broncos in Week 18 when they rested their starters. So, let’s open the sample size up and look at playoff games since 2002 where a team had an edge of 70-to-130 points in scoring differential. Then let’s sort those games by FAR differential and look at the biggest outliers.
Teams with a FAR differential above 4.5 and scoring differential between 70 and 130 are just 4-10 in the playoffs.
What about the small spread in this game as the Chiefs are a 1.5-point favorite against the Eagles? That’s some of the worst looking news for the Eagles yet.
Since 2002, there have only been 21 NFL playoff games with a spread of 0-to-2 points. The team with the higher FAR (Eagles) is just 6-15 (.286). Guess which team with the lower FAR accounted for six wins, including 5 of the top 11 games? The Mahomes-led Chiefs.
In theory, playoff games with a spread this small should be the toughest to predict as they’re basically telling you it’s a toss-up, right? Yet, here is how you would have done on those 21 games if you made your prediction based on these stats:
Still think I’m crazy? Still think I’m the fraud here? We’ll see what happens when the team that ranks 23rd in Fraud Alert Rating since 2002 takes on the team that’s 446th and seeking the three-peat.
Related Articles: